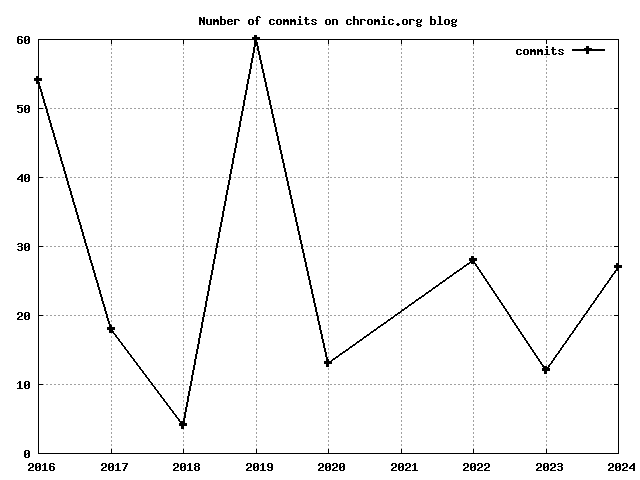
Plot git-commits on a Graph with gnuplot
By chimo on (updated on )After going down some Internet rabbit hole, as one does, I somehow ended up on a dillo browser blog post. The blog post is interesting on its own, and something that caught my eye was their graph of git-commits over time, made with gnuplot.
The command they used is in the footnotes:
git log --pretty='format:%cd' --date=format:'%Y' | sort | uniq -c \
  | awk '$2>2000{print $2,$1}' \
  | gnuplot -p -e "set grid; set term pngcairo size 1000,300;\
set output \"commits.png\"; \
set title 'Number of commits in the Dillo repository over time since 2007'; \
plot '-' title 'commits' with linespoints lw 2 lc rgb \"black\""
Neat!
